Apple Inc (AAPL)
Technical Analysis
Price | USD 117.51.
Market Capitalization | USD 2T.
Long Term Trend | Up.
Short Term Trend | Price moving downwards temporary within the uptrend channel.
Support Line | USD 103.
Resistance Line | USD 139.
Stochastic | In the neutral zone and moving downwards.
Conclusion
AAPL is showing short term weakness. Long term trend is a healthy chart-wise.
For stock financial data, please refer to the previous AAPL post dated 8 Sep 20.
Technical Analysis
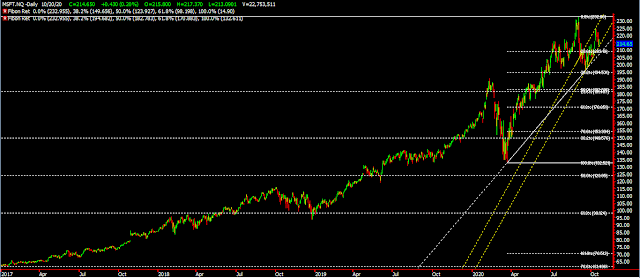
Price | USD 214.65.
Market Capitalization | USD 1.6T.
Long Term Trend | Up.
Short Term Trend | Price moving downwards temporary within the uptrend channel.
Support Line | USD 194.
Resistance Line | USD 233.
Stochastic | In the neutral zone and moving downwards.
Conclusion
MSFT price is moving down temporarily. The long-term trend is still upward.
For stock financial data, please refer to the previous MSFT post dated 21 Sep 20.


No comments:
Post a Comment